.svg)
Shopify Inventory Reports: A Complete Guide to Reading and Using Them (2026)


Shopify inventory reports are built-in Analytics reports that show how much stock you hold, what it’s worth, and how fast each product variant is selling. They cover month-end snapshots, inventory value, sell-through rate, ABC analysis, and daily units sold.
One caveat up front: these reports are period-based, not real-time, so the numbers reflect a closed period rather than your stock levels right now.
Quick-start — if you only check three reports, start with these:
- Open Inventory remaining per product → find any variant whose days remaining is below your supplier lead time. That’s your reorder list.
- Open Products by percentage sold → flag anything sold under ~40% for the period. That’s your markdown list.
- Open Month-end inventory value → if it’s climbing while sales are flat, stop buying. That’s your cash-flow alarm.
What you’ll learn: where to find every native report, what each report shows, and which columns matter. Also how to read your inventory quantity fields (Available, Committed, Incoming), what “good” numbers look like by product category, where the native reports fall short, and how to turn all of it into reorder and cash-flow decisions.
If you’ve ever wondered why you keep running out of your bestsellers while sitting on piles of dead stock, your inventory reports already hold the answer.
The problem is rarely a lack of inventory data; it’s not knowing which report to open or what the numbers mean. This guide fixes that.
Already run inventory at scale?
Skip the fundamentals and jump to the operational depth: the full 9-report roster with red-flag thresholds, the adjustment audit-trail reports for shrinkage and process control, how to interpret the benchmark ranges, export-and-combine workflows for multi-report analysis, and where native reports stop and a dedicated tool earns its place.
What Are Shopify Inventory Reports?
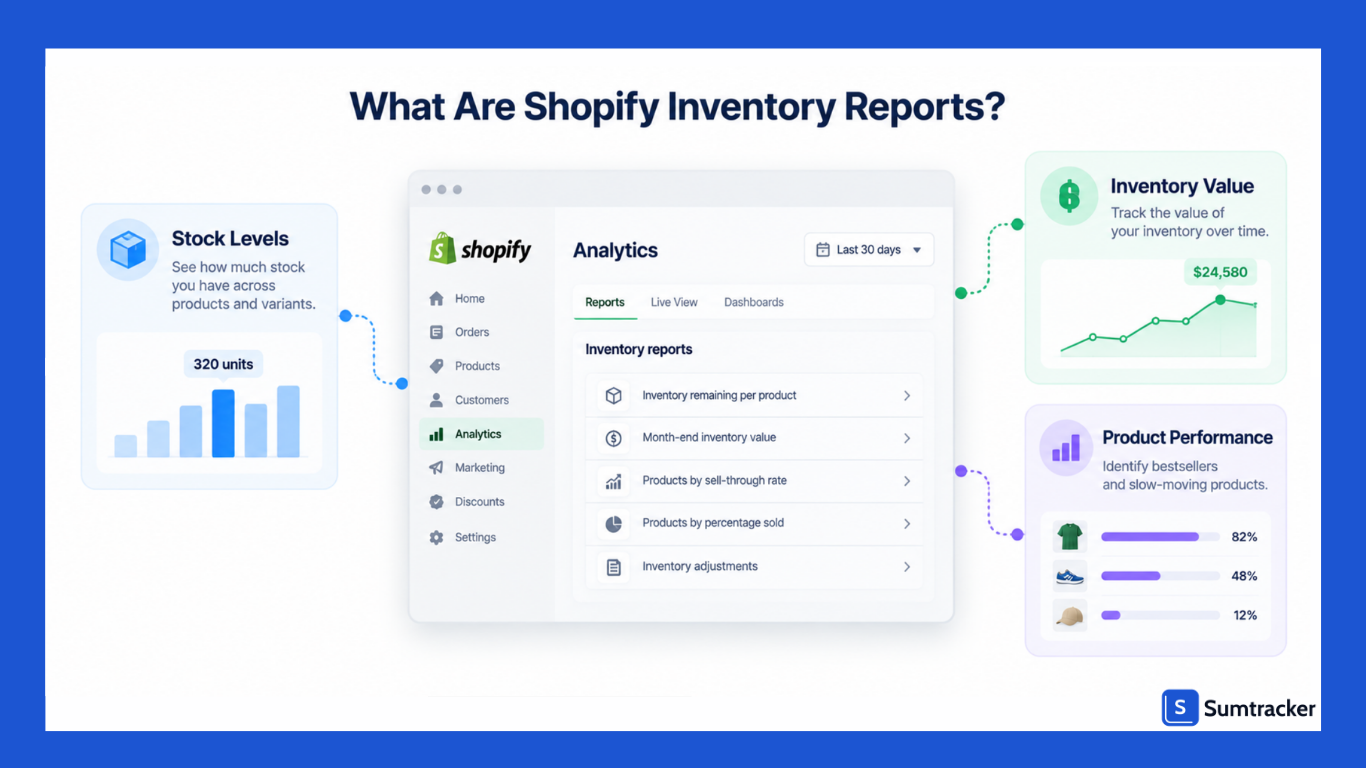
Shopify inventory reports are a set of built-in reports in Analytics > Reports that help you monitor stock levels, inventory value, and product performance over time.
They give historical snapshots of your inventory quantity and highlight fast sellers, slow movers, and out-of-stock risks.
Shopify tracks stock at the product variant level, so every report breaks results down by product variant rather than by parent product, which is why inventory quantity, stock levels, and inventory value are all reported per product variant.
In plain terms, these reports answer questions like:
- Which products are running low and need a reorder?
- Which items aren’t selling and are tying up cash?
- How much is my current inventory worth, and how has it moved month to month?
The goal is to help you avoid stockouts, reduce excess inventory, and order the right products at the right time.
Good inventory management relies on accurate inventory reporting: these reports improve cash flow forecasting and reduce holding costs by flagging slow-moving stock before it becomes dead inventory.
Instead of relying on guesswork, you can see which products are selling well, where inventory is building up, and when it’s time to reorder.
A quick worked example. Say the Products by percentage sold report shows a candle variant with 1,000 units stocked at a $12 cost per item, and only 120 sold this quarter, meaning 12% sold.
For a home-goods line on a ~12-week overseas production cycle, anything under about 25% a quarter is slow, so 12% is a clear red flag, not seasonal noise. That slow mover is tying up roughly $10,560 in cash (880 unsold units × $12) on a shelf. The report doesn't just show the product is slow; it quantifies how much inventory cost is tied up in it.
Inventory reporting isn’t just a Shopify-only nicety; it helps understand how much capital retail ties up in stock.
In the US, retailers hold about $1.32 of inventory for every $1.00 of sales, according to US Census Bureau data cited by Shopify.
That ratio is exactly why reading your inventory reports well is a cash-flow decision, not just an operations chore.
In short: Shopify inventory reports turn raw stock data into decisions — what to reorder, what to stop buying, and where cash is stuck. They’re period-based, variant-level, and available on every plan (with the custom-report nuance noted below).
How to Access Inventory Reports in Shopify
Getting to your inventory reports is straightforward, and you don’t need to be a data analyst to find them.
On desktop:
- Log in to your Shopify admin.
- In the left menu, go to Analytics, then Reports.
- Click the Category filter.
- Select Inventory to filter the list to inventory reports only.
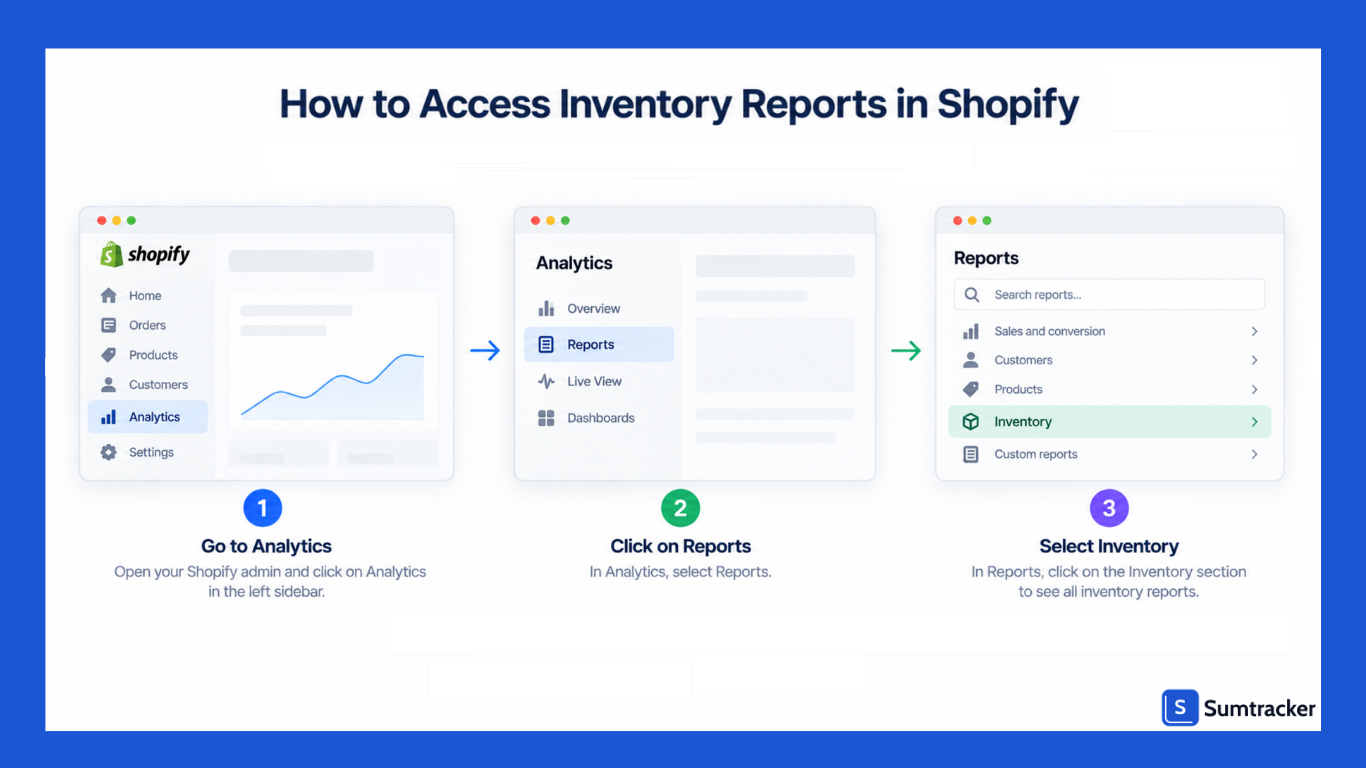
On mobile (Shopify app): tap the menu icon, then Analytics > Reports, tap the filter icon, choose Category, and select Inventory.
Two things to know before you rely on them:
- Historical data for inventory-based metrics only goes back to October 1, 2023. Data before that date isn’t available for inventory reports.
- Shopify occasionally changes its admin navigation. If you don’t see Reports under Analytics, use the admin search bar to find it.
Which plan do you need? You can access all nine default inventory reports across all plans. Higher-tier plans provide additional reporting and analytics capabilities.
You can also customize reports and create custom inventory explorations using Shopify’s reporting tools and ShopifyQL, although some reporting capabilities vary by plan.
If you need more specialized inventory reporting, automation, or reporting beyond Shopify’s native capabilities, you can use an inventory management app such as Sumtracker.
The 9 Native Shopify Inventory Reports (2026)
Shopify ships nine inventory reports as per the Shopify Help Center. Here’s the full roster, what each report shows, and one red-flag metric to watch in each.
Month-end inventory snapshot
This report displays the ending inventory quantity of each product variant you had in stock at the end of each month. The key column is Ending quantity, which shows the trackable available inventory for each product variant at the close of the period.
Available inventory here excludes Committed inventory (units on unfulfilled orders) and Incoming inventory (units in a transfer).
A negative ending inventory quantity means you oversold that product variant. Use this report for financial close and to compare ending inventory trends month to month.
Worked example: A variant shows Ending quantity -5. That means inventory is below zero, but 5 starting units and 8 orders alone would result in -3, not -5. If you see -5, check for earlier negative stock or inventory adjustments, then review Inventory adjustment changes and confirm the variant is set to stop selling when out of stock.
Month-end inventory value
The month-end inventory value report totals your available inventory value: cost per item × ending quantity, summed across every product variant. It counts only product variants with a cost per item assigned. This report tells you how much capital is tied up in ending inventory.
Note the wording carefully: it uses the cost per item field, which usually excludes freight, duties, and tariffs — so your true landed cost can run 10–30% higher than this report shows. If month-end inventory value is climbing while revenue is flat, you’re overbought.
Inventory sold daily by product
Also known as average inventory sold per day, this report helps you track the quantity sold per day for product variants during a selected period (quantity sold ÷ days in the period). It's your sales-velocity signal.
Worked example: a skincare variant sells 8 units per day, and you have 40 units on hand — that’s 5 days of cover. If your supplier’s lead time is 14 days, you’re already 9 days short and need to reorder today. Pairing velocity with stock on hand answers the real question — should I reorder this SKU today? — before the days run out.
Products by percentage sold
This report shows the percentage of each variant’s starting quantity that sold during the period. It’s the long-horizon view: if you started with 1,000 units and sold 120, the report shows 12% sold. Use it to identify products that may be moving slowly and need a closer look.
No single percentage sold indicates healthy inventory for every product. The right benchmark depends on the product, selling period, seasonality, margins, and lifecycle.
Before discounting or reducing reorders, compare the percentage sold with Products by sell-through rate and Inventory remaining per product to get a clearer picture of how the product is performing.
Products by sell-through rate
Shopify’s sell-through rate report calculates:
Sell-through rate = total items sold ÷ (total items sold + total items still in inventory)
The denominator represents the stock on hand during the period, including restocks or new inventory received during that time. The report ignores negative inventory quantities and only includes variants sold at least once.
There's also a ~2-day processing delay, so the most recent date available is roughly two days behind today. A healthy sell-through varies by category (benchmarks above), but a rate persistently under ~40% usually signals overstock.
ABC product analysis
The ABC analysis report grades every product variant based on its share of revenue over the last 28 days. The window is fixed and updates daily.
A-grade products collectively account for 80% of revenue, B-grade the next 15%, C-grade the final 5%. Cost doesn’t factor into the grade.
One important nuance: ABC analysis ranks by revenue contribution, not profit. A $500 item sold once can rank higher than a $50 item sold eight times, even if the cheaper item has an 80% margin.
So use ABC to prioritize reorder attention, not to judge which SKUs are most profitable.
Inventory remaining per product (days of inventory remaining)
Contrary to a common myth, Shopify did not remove this report; it’s live as Inventory remaining per product.
It estimates how long your tracked inventory will last: ending quantity ÷ average units sold per day, using sales velocity from the last 28 days. If a variant’s days remaining is lower than your supplier’s lead time, you’re already late to reorder.
Variants with no recent sales show N/A; negative stock shows 0.
Inventory adjustment changes
This report shows every change made to inventory during a selected period, like manual edits, changes from inventory apps, transfer receipts, and order fulfillments, and how stock levels moved between states.
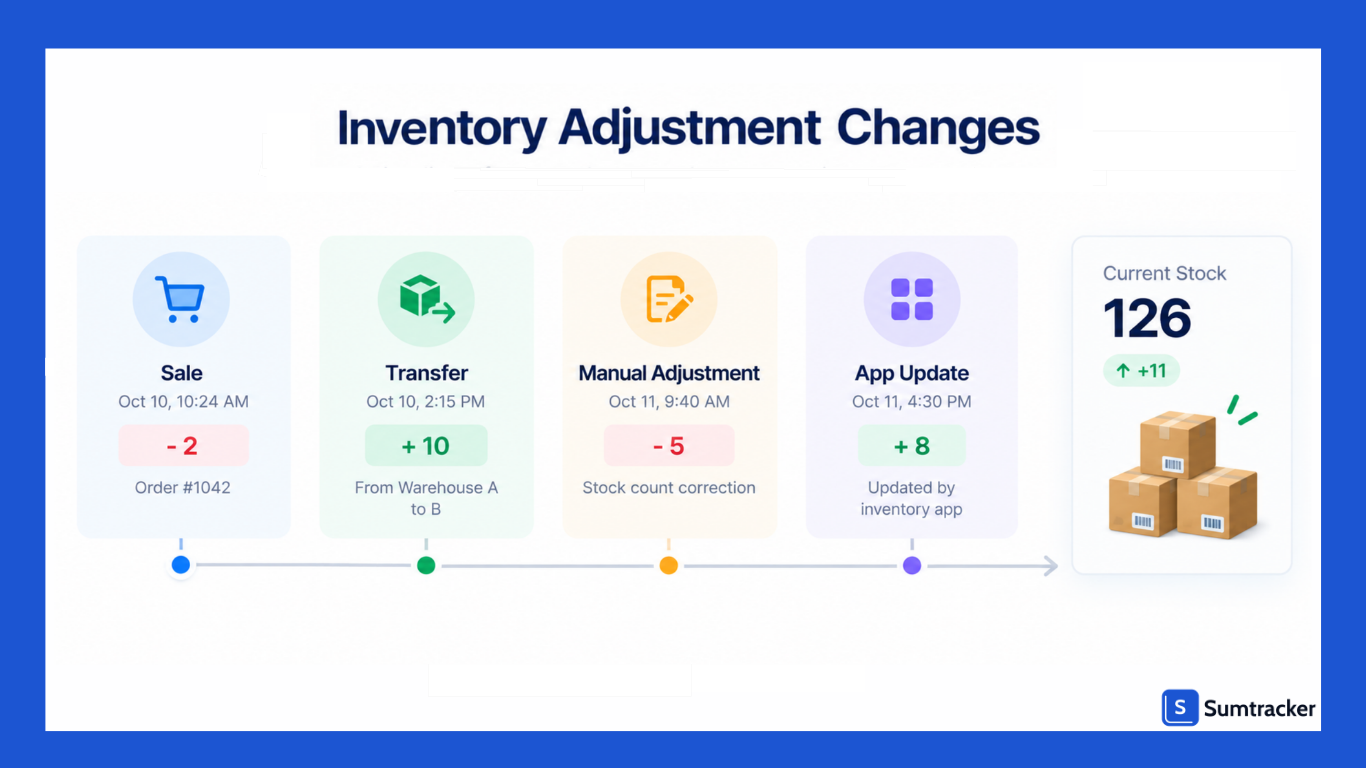
When an order for 3 units comes in, the available inventory quantity drops by 3 and Committed rises by 3, and both inventory adjustments appear here. It’s useful for investigating shrinkage and inventory discrepancies.
Rule of thumb: if unexplained downward inventory adjustments (not tied to a sale, transfer, or known damage) exceed 1% of total units moved in a month, treat it as a shrinkage signal and run an audit. This can help you catch theft, miscounts, and process leaks before they compound.
Inventory adjustments by count
This report counts how many inventory adjustments happened, regardless of the number of units involved, by staff member, location, or app.
Use it to answer process questions: which location logged the most inventory adjustments last month, or how many adjustments each app created.
Benchmark: if any single location or user generates more than 3× the average adjustment count across your locations in a month, investigate the process there.
For example, one warehouse logging 320 adjustments against a 90-per-location average usually points to a broken receiving or counting workflow, not 320 separate inventory issues.
How to Read Your Inventory Report Data Fields
Open any inventory report, and you’ll see a few quantity fields that can be confusing. Here’s what each inventory quantity state actually means in Shopify.
The key distinction to remember:
Available inventory is not the same as On hand. In Shopify, On hand is made up of Committed, Unavailable, and Available inventory, while Available excludes Committed, Unavailable, and Incoming units. Month-end snapshot and month-end value both report on Available inventory, excluding Committed and Incoming units.
So a report might show 50 units available even though another 20 units are already committed to orders. (Sumtracker’s guide to Shopify committed inventory walks through this in detail.)
How to Interpret Key Inventory Metrics
Knowing what the numbers mean is more useful than simply listing the reports. Here are working benchmarks.
The benchmarks below are starting points, not fixed rules. Your margins, seasonality, and business model can all affect what a healthy number looks like. For inventory valuation or markdown decisions, use these as a guide and confirm the numbers with your accountant.
A few industry benchmarks help put these numbers in context. Top-performing businesses keep stockouts below 2% and excess inventory at 26% or less, while weaker performers can carry 50% or more.
Real-time inventory visibility can also make a measurable difference: a 2025 GS1 US study found that 68% of companies using real-time tracking reported better inventory control.
Stock availability also affects customer behavior; 44% of consumers have switched stores because a product was unavailable. In other words, a stockout can mean more than a missed sale; it can also mean a lost customer.
Watch: reading the reports that matter. For a click-by-click walkthrough of the Shopify Analytics reports interface, see this 2026 tutorial: Shopify Analytics Tutorial: How to Read the Reports That Matter.
Inventory turnover deserves a special note: Shopify has no native turnover report. You have to export COGS from Finance reports and ending inventory value from inventory reports, then calculate turnover yourself (COGS ÷ average ending inventory). Sumtracker’s inventory turnover calculation guide covers the formula and category benchmarks in depth.
How a Smart Shopify Merchant Actually Uses These Reports
Reports only matter if they drive decisions. Here’s a weekly workflow that takes under 30 minutes:
- Inventory sold daily by product → identify fast movers and current velocity.
- Inventory remaining per product → flag SKUs whose days of cover are under supplier lead time.
- Products by sell-through rate → validate which products are genuinely performing.
- Create purchase orders for high-performers using reorder point = (daily sales × lead time) + safety stock.
- Discount or bundle low percentage-sold SKUs to free up cash.
Worked example of step 4: a SKU sells 12 units per day, your supplier’s lead time is 7 days, and you hold 20 units of safety stock.
Reorder point = (12 × 7) + 20 = 104 units. When inventory approaches 104 units, it’s time to review whether you need to reorder. That loop separates reactive restocking from data-driven operations. Sumtracker’s reorder point guide shows how to build these triggers from velocity and lead time.
The if-then protocol that ties the reports together. No single report makes the call — the decision comes from combining days-remaining, ABC grade, sell-through, and unit cost. Run this branching logic once a week:
- If days remaining < lead time AND the variant is ABC grade A → prioritize the reorder.
- If days remaining < lead time BUT the variant is grade C → let it run down and consider discontinuing — don’t tie fresh cash into a tail SKU.
- If sell-through < 40% AND cost per unit > $50 → review the SKU for a possible markdown or reduced reorder.
- If month-end value is rising AND average units sold/day is flat → review whether you should reduce upcoming orders.
The point is that the reports are inputs to one decision, not four separate readings—the protocol turns the data into a single next action.
Limitations of Native Shopify Inventory Reports
The built-in inventory reports are genuinely useful, but there are a few limitations to keep in mind:
- Period-based, not real-time. Reports refresh on a period boundary (sell-through runs ~2 days behind). Shopify has no native “current inventory” report. For live current-inventory tracking, use Products > Inventory page or a dedicated app.
- No native inventory turnover report. You need to calculate turnover using your COGS and inventory values.
- Cost per item ≠ landed cost. Month-end value uses the cost-per-item field, which doesn’t include freight, duties, and tariffs.
- Fixed windows. ABC analysis is locked to the last 28 days; you can’t widen it for seasonal SKUs.
- Variant-level, not parent-level. A product with multiple sizes and colors appears as separate variants, which can make it harder to analyze the product as a whole.
- Custom explorations need a higher plan. The default nine reports run on every plan, but building your own inventory adjustment explorations (and scheduling emailed reports) requires Advanced Shopify or Plus.
None of this makes the native reports bad — it makes them a starting point. Knowing the limitations is what lets you read them without being misled.
When Native Reports Are Enough — And When You Need a Dedicated Tool
For a single-location store with a few hundred SKUs on one sales channel, the native inventory reports are usually enough. You outgrow them when specific thresholds stack up:
- Need real-time inventory reporting instead of relying on reports with processing delays.
- Want to combine data from multiple inventory reports without exporting and working in spreadsheets.
- Need custom inventory reports that Shopify’s standard reports don’t provide.
- Want automated inventory reports and alerts instead of checking reports manually.
- Need to analyze inventory data across longer or custom time periods than Shopify’s fixed reporting windows allow.
At this point, dedicated inventory management software can fill the gaps in Shopify’s native reporting. Sumtracker, for example, adds real-time multi-channel inventory sync at the product variant level, bundle and component tracking, demand forecasting, and purchase orders — the live, cross-channel inventory management view the period-based native reports can’t provide, with accurate stock for every product variant across channels.
The results are concrete. When Babymaxi moved from an in-house warehouse to multiple 3PLs, they used Sumtracker, which provides more detailed inventory reporting, including historical inventory, stock valuation, days of inventory remaining, and inventory logs. See how Babymaxi manages multi-location inventory on Shopify.
How to Export and Customize Shopify Inventory Reports
Shopify lets you filter data, adjust time ranges, and add or remove metrics and dimensions.
You can also save report changes as custom data explorations, regardless of your Shopify subscription.
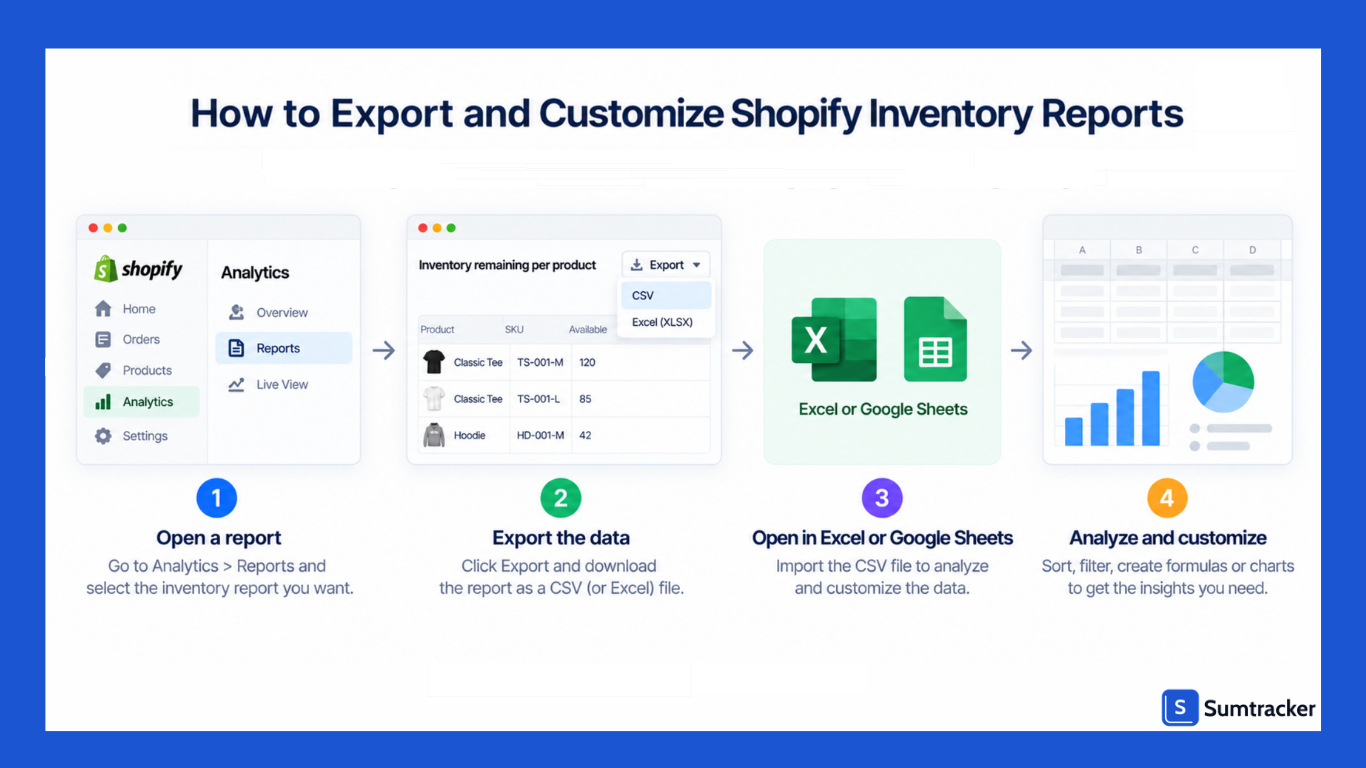
If you need to work with the data outside Shopify, you can export a report and analyze it in Excel or Google Sheets. This is particularly useful when you want to combine data from different reports or add your own calculations.
Step by step:
- In your Shopify admin, go to Analytics > Reports and open the inventory report you want (say, Month-end inventory value).
- Set the date range and, for multi-location stores, apply the Location filter so each export is location-specific (exporting all locations into one file is where double-counting starts).
- Click Export (top right) and choose CSV; pick “current page” or “full report” data.
- Open the CSV in Excel or Google Sheets and combine it with another report or add your own calculations.
A sample days-of-cover formula in Sheets is =Ending_Quantity / Avg_Units_Sold_Per_Day. This follows the same basic calculation Shopify uses for its Inventory remaining per product report.
Once you have the data in a spreadsheet, you can add fields such as supplier lead time, margin, or reorder points to build your own inventory analysis.
Sumtracker’s guide to exporting inventory from Shopify covers exporting by location and reading the Available/On hand/Committed columns.
A practical tip: If you notice an unexpected change in inventory after exporting a report, check Shopify’s Inventory adjustment changes report to see what caused it.
Common Inventory Reporting Mistakes to Avoid
Even accurate reports get misread. The most common mistakes:
- Confusing Committed with Available. Available inventory is what Shopify currently considers available to sell, while committed inventory is already allocated to unfulfilled orders. Don't treat Available as the same as physical stock on hand.
- Comparing across shifted period boundaries. If you change your store’s time zone mid-month, historical reports don’t recalculate — you can get a February report covering 27 days and a March one covering 33, which wrecks month-over-month comparisons.
- Reading aggregate sell-through and stopping there. A 73% blended sell-through can hide big differences between products — some may be at 89% while others are only at 41%. A real buying imbalance the top-line number masks. Filter by product type before you draw conclusions.
- Mistaking price inflation for stock growth. If month-end value rose 40% but average units sold per day held flat, you didn’t grow stock depth — your per-unit costs went up.
- Double-counting multi-location stock. When the same SKU lives in several locations, aggregate views can hide a stockout at your primary location while a fulfillment center 2 weeks out shows healthy totals.
If your numbers simply don’t match what you expect, work through Sumtracker’s guide to fixing inventory mismatches before you trust the export.
How Often Should You Run Inventory Reports?
Match cadence to your inventory changes. Monthly is enough for accounting close, but reacting monthly means reacting to what already happened.
Why cadence matters: a top SKU selling 200 units/day with a 10-day lead time needs ~2,000 units of cover. If a supply delay hits and your weekly review catches it 5 days late, you’re already 1,000 units into a stockout before you place the PO, whereas a daily glance at low stock would have caught it on day one.
Reserve the month-end snapshot and value reports for financial reconciliation; run the fast-moving reports on the cadence that matches how quickly a variant can sell out.
Why Your Inventory Numbers Don’t Match (Troubleshooting)
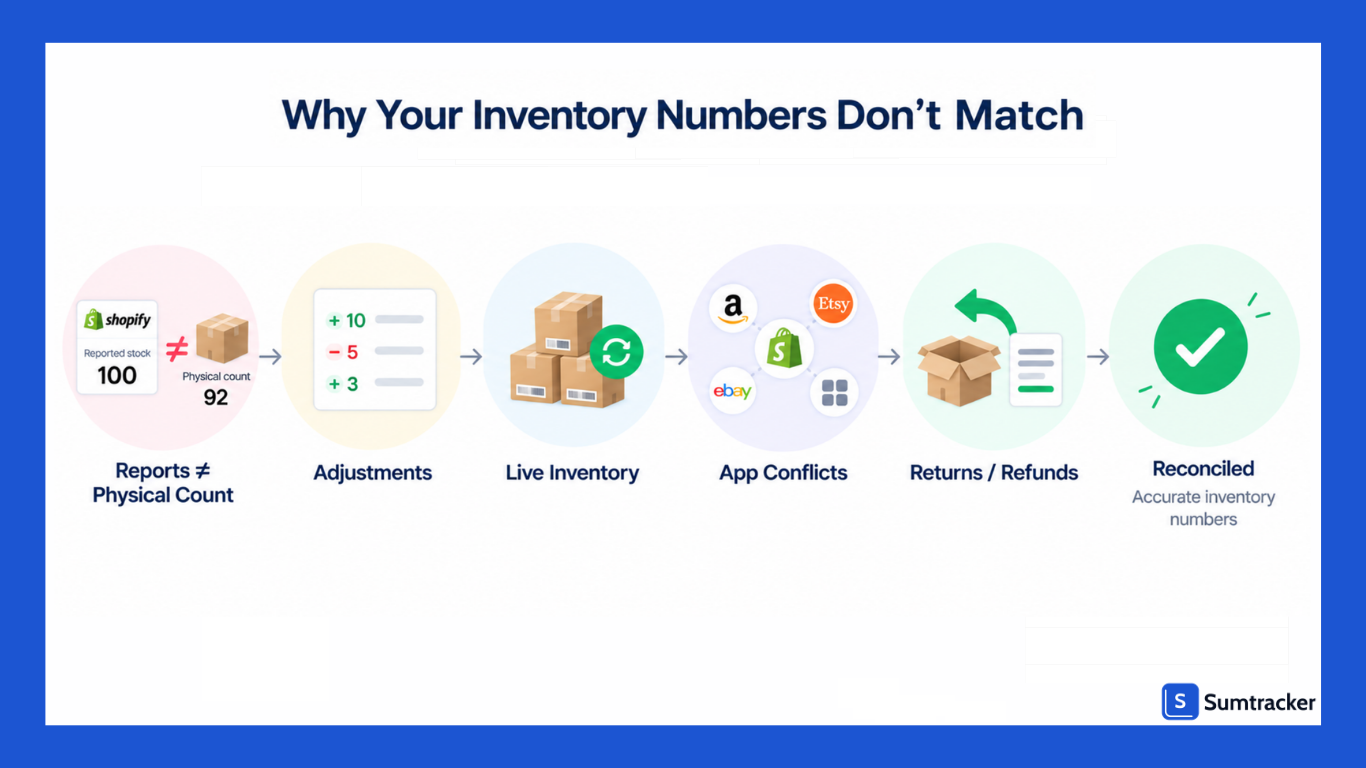
Mismatches between your reports, your Products page, and your physical count usually trace to one of four causes: syncing delays, manual inventory adjustments not yet reflected, app conflicts (for example, two inventory apps both writing Available quantities for the same SKU and overwriting each other), or returns and refunds processed in a different period than the sale.
Work through it in order:
- Open the Inventory adjustment changes report and check recent edits — it logs every change and is the fastest way to find where two numbers diverged.
- Compare against the live Products > Inventory page for the current on-hand count.
- If they still disagree, disable third-party inventory apps one at a time to find the one writing conflicting values.
- Reconcile returns and refunds by period, since a return booked in a later period won’t appear in the sale’s period.
Inventory Reporting by Business Model
There’s no single “right” set of reports—the right inventory management approach depends on how you operate.
- Dropshipping / made-to-order: stock levels matter less; lean on sell-through and ABC analysis to spot demand, not reorder points. Target days of cover: near-zero (you don’t hold stock).
- Multi-location retail: location-level reporting is essential. Build custom inventory adjustment reports with the location dimension, and watch per-location days of cover — aim for 20–40 days per location.
- Bundle-heavy / kitting brands: native reports track the bundle SKU, not its components, so component stock drifts. This is where component-level tracking outside Shopify earns its keep.
- High-velocity DTC: check sell-through and days remaining frequently. For example, if a SKU sells 50 units/day, has a 14-day lead time, and you want 3 days of safety stock, the reorder point is 50 × (14 + 3) = 850 units. When inventory reaches that level, it’s time to reorder.
Best Practices for Inventory Reporting
- Review weekly, not just monthly — catch stockout and overstock risks before they cost sales.
- Set reorder points from data, not gut — (daily sales × lead time) + safety stock.
- Segment with ABC analysis — the standard cutoffs are A = the top ~80% of revenue (usually only ~20% of your SKUs), B = the next ~15%, C = the final ~5%. Put tight control on A items and minimal effort on C items.
- Track value alongside quantity — 200 units at $3 and 200 at $60 show very different amounts of capital tied up in inventory.
- Read trends, not just snapshots — month-end reports miss the seasonal shifts a trend line shows.
- Cross-reference with sales and returns — a high-return SKU can inflate apparent sell-through.
- Automate alerts — low-stock thresholds and auto-flagged slow movers beat manual checks during busy periods.
The payoff for acting on reports rather than filing them is measurable in practice: using real-time sync and automated reordering off this kind of report data, Sumtracker customer Crafter’s Lab cut overselling by 99.7% and saved 8–10 hours a week on manual stock work.
Conclusion
Shopify inventory reports aren’t just about knowing what’s in stock; they tell you how each product performs, where your cash is tied up, and how to stay ahead of stockouts and overstocking.
When used consistently, the nine native reports become a weekly decision engine: what to reorder, what to discount, and what to stop buying.
But they also have limitations like period-based data, no native turnover report, variant-level views, and cost-per-item valuation that misses landed cost.
These reports are enough to manage day-to-day inventory decisions. As your reporting needs grow, you may want a dedicated inventory tool that provides historical data, additional inventory views, and automated reporting.
Your next step: open Inventory remaining per product right now and list every variant whose days remaining are below its supplier lead time; that’s your reorder list for this week. Then try Sumtracker free for 14 days to turn your Shopify inventory data into real-time, multi-channel decisions — synced stock, bundle tracking, demand forecasting, and one-click purchase orders.
FAQ: Shopify Inventory Reports
What reports are available in Shopify for inventory?
Shopify offers nine native inventory reports: Month-end inventory snapshot, Month-end inventory value, Inventory sold daily by product, Products by percentage sold, Products by sell-through rate, ABC product analysis, Inventory remaining per product, Inventory adjustment changes, and Inventory adjustments by count. You can find them all under Analytics > Reports > Category > Inventory, on every plan.
Can I get real-time inventory reports in Shopify?
Not natively. Shopify’s inventory reports are period-based, and the sell-through report runs about two days behind. Shopify has no built-in current-inventory report — you check the Products > Inventory page for live counts, or use a third-party app for real-time, cross-channel visibility.
Can I download Shopify inventory reports as CSV?
Yes. Any inventory report can be exported to CSV and opened in Excel or Google Sheets, where you can combine reports and build calculations like turnover or days of cover that Shopify doesn’t compute natively.
How do Shopify inventory reports handle product variants?
Every inventory report is variant-level, not parent-level. A product with 8 sizes and 4 colors appears as 32 separate variant rows. To analyze a product family as a whole, export to a spreadsheet and group by product, since Shopify won’t aggregate variants for you.
Is Shopify’s built-in inventory reporting enough, or do I need an app?
Native reports are enough for a single-location store on one channel. You may want a dedicated tool when you need more detailed historical data, additional inventory views, real-time reporting, or automated reports and alerts beyond what Shopify provides.
Conclusion

Bhoomi writes about inventory management and multichannel selling at Sumtracker. Her focus is on solving real operational problems for Shopify, Amazon, and marketplace sellers through well-researched content. She covers everything from multi-location inventory syncing and stock error troubleshooting to replenishment planning and platform comparisons, turning complex eCommerce operations into clear, actionable guidance.
LinkedInRelated Articles
Tool and strategies modern teams need to help their companies grow.

Ready to Simplify Your Inventory Management?
Join hundreds of e-commerce merchants who rely on Sumtracker to save time, eliminate errors, and grow their business.
