.svg)


If you’ve ever thought, “Why am I always out of stock on my bestsellers… but sitting on piles of dead inventory?”
Well your reports already have the answer.
The problem isn’t lack of data. It’s not knowing what to look for.
Most Shopify merchants open inventory reports, glance at a few numbers, and close the tab.
But the ones who actually grow?
They use these reports to decide what to reorder, what to stop buying, and where cash is getting stuck.
In this guide, we’ll break down Shopify’s key inventory reports and more importantly, how to turn them into real business decisions.
What Are Shopify Inventory Reports?
Shopify inventory reports are built-in tools that help you monitor how much stock you have, what’s moving, and what’s not.
They provide historical snapshots of your inventory levels and highlight trends like fast-selling items, slow movers, and out-of-stock issues.
In short, these reports answer questions like:
- Which products are running low?
- Which items aren’t selling at all?
- How has my stock level changed over time?
The goal?
To help you avoid stockouts, reduce dead stock, and order the right products at the right time.
How to Access Inventory Reports in Shopify
Getting to your inventory reports in Shopify is straightforward and no, you don’t need to be a data geek to find them.
Here’s how to access them step-by-step:
1. Log in to your Shopify admin dashboard.
2. From the left-hand menu, click on “Analytics.”
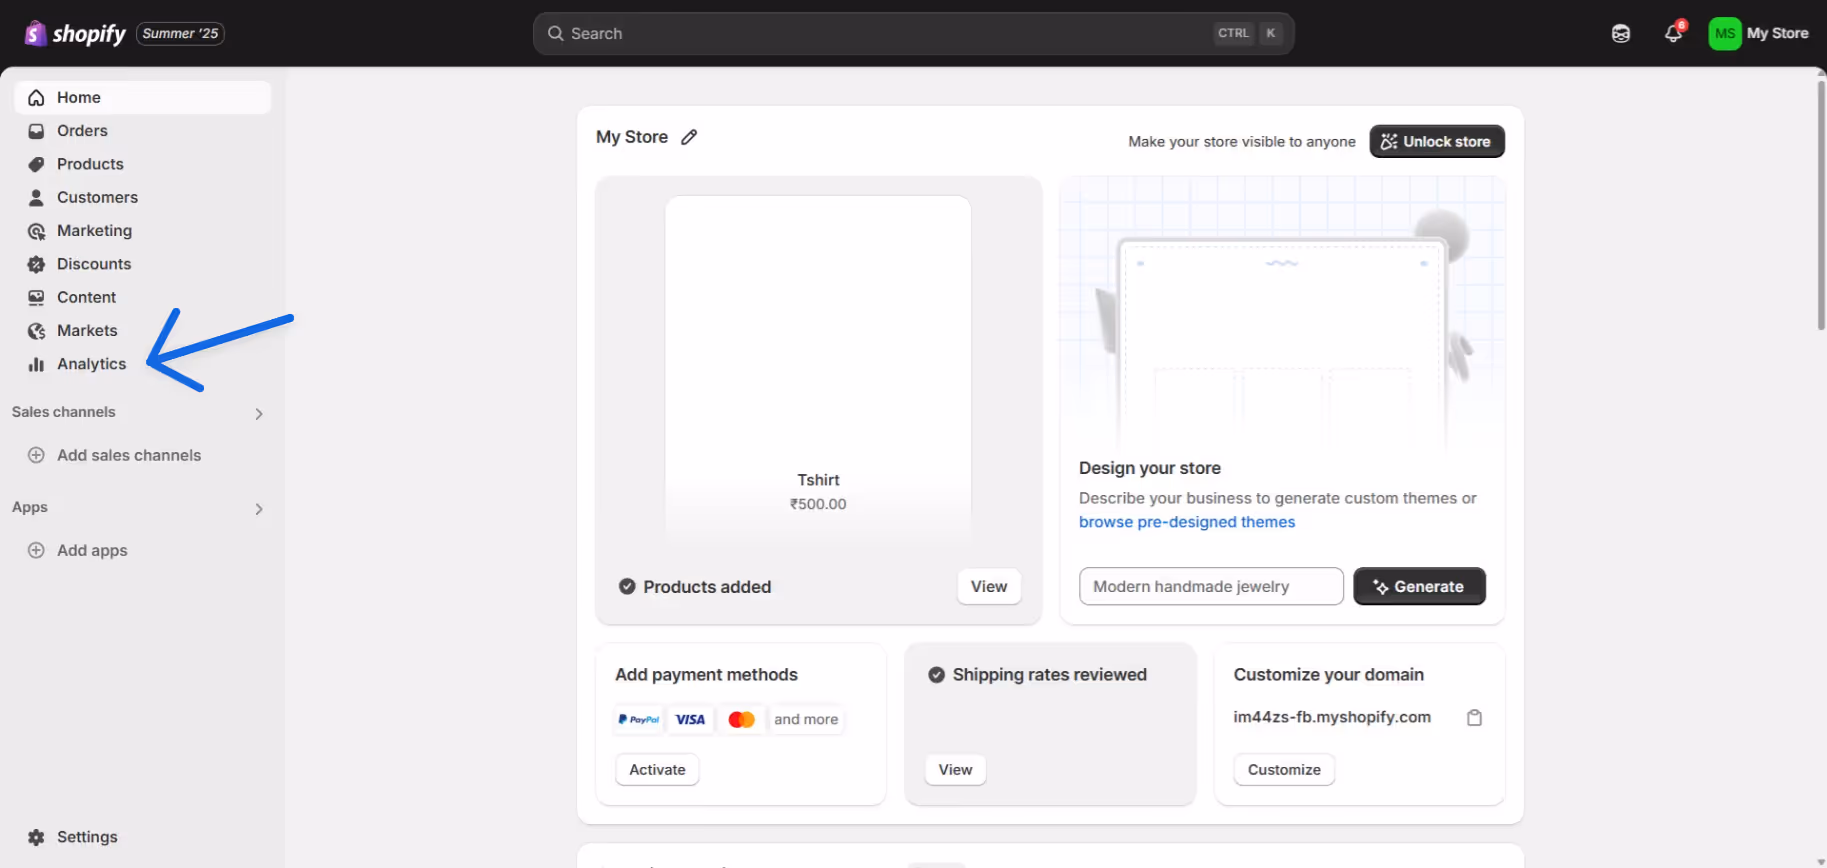
3. Then go to “Reports.”
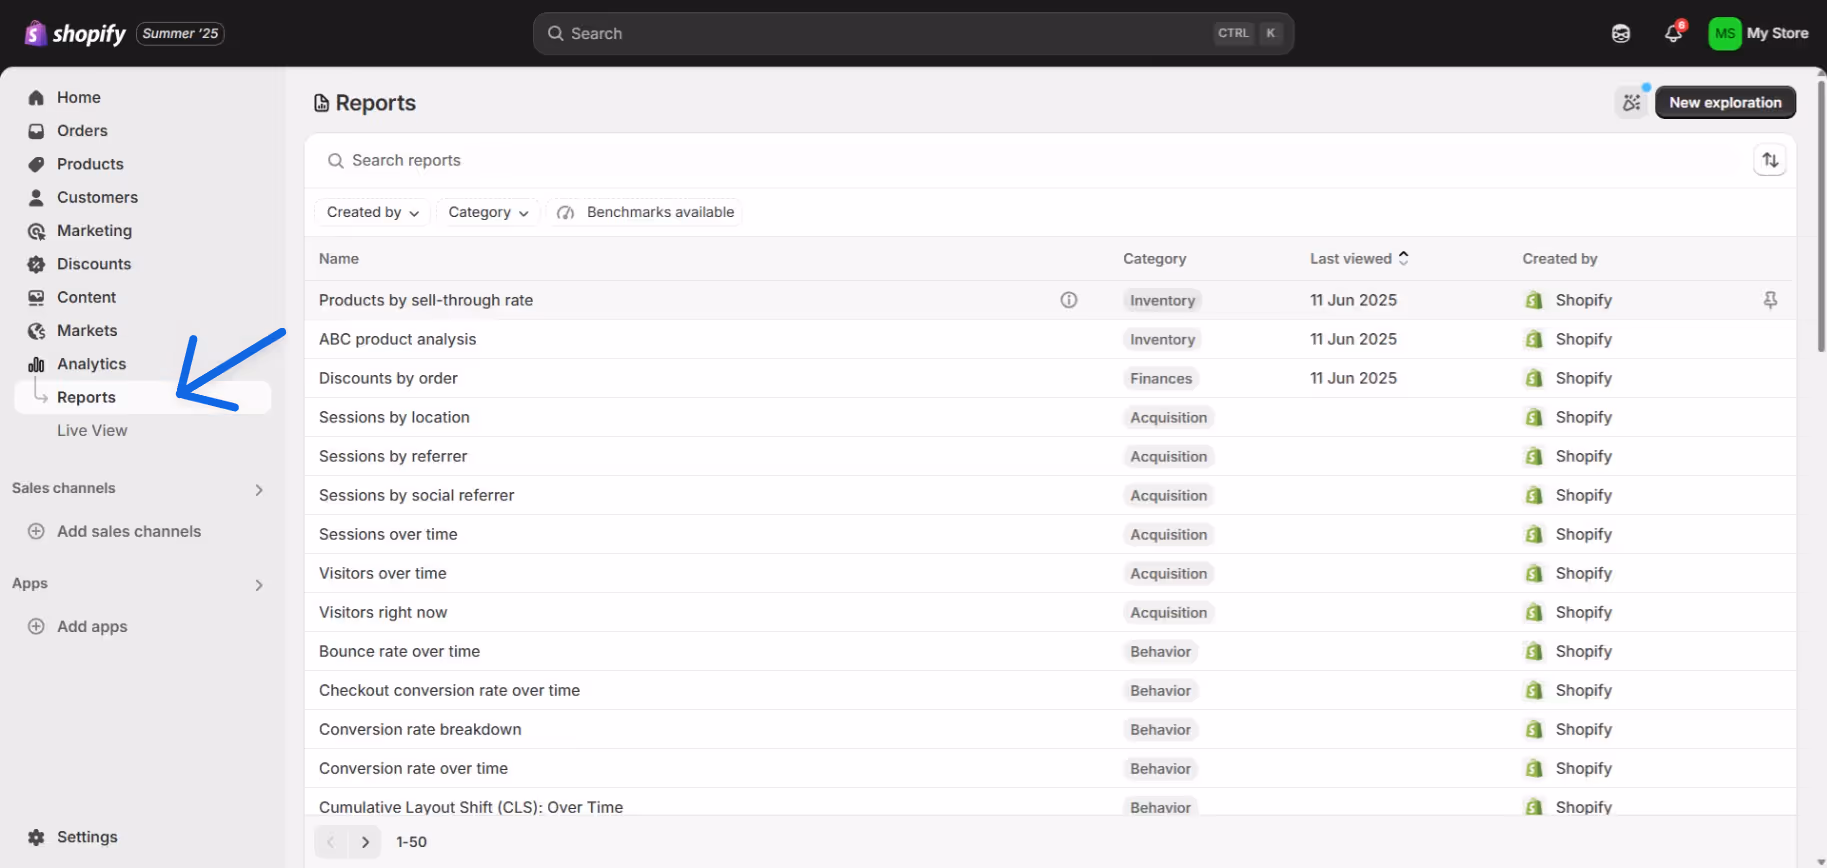
4. Go to Category and scroll down or search for the Inventory section.
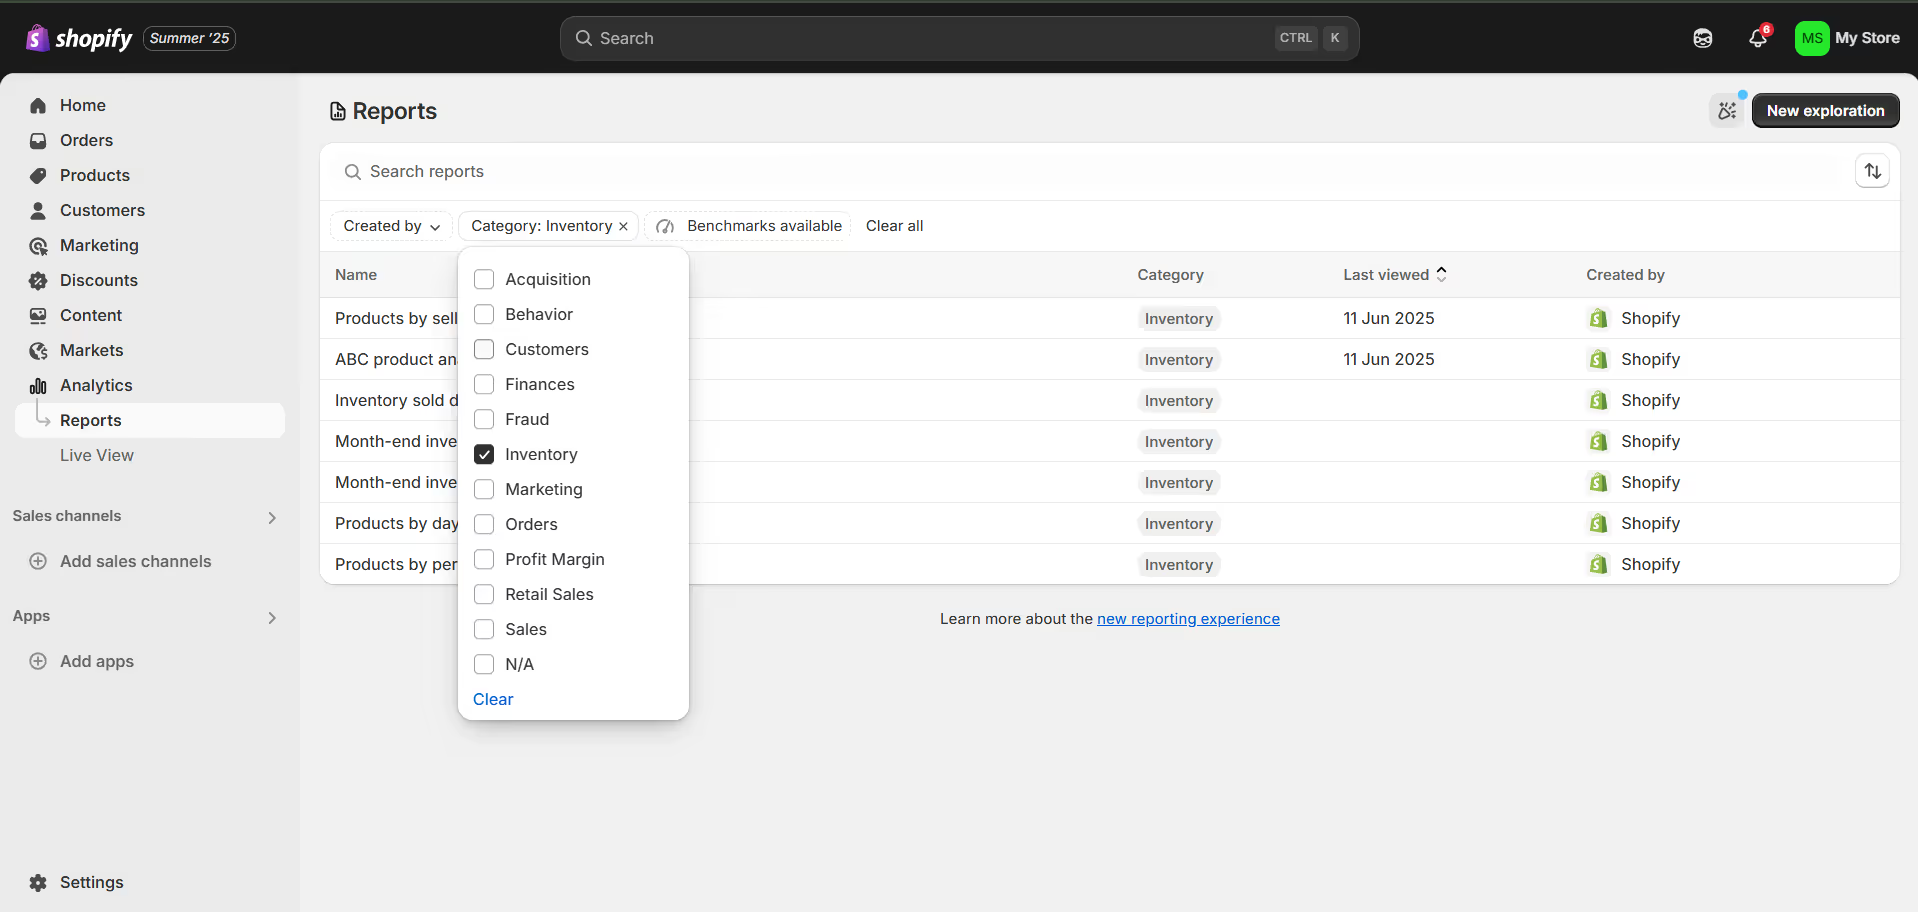
You’ll see several pre-built inventory reports like Month-End Inventory Snapshot, Sell-Through Rate, Average Sold Per Day, and more.
If you can’t find the report you're looking for or want more in-depth insights, that’s where tools like Sumtracker or other inventory management apps can fill in the gaps.
They integrate directly with Shopify and give you more detailed and customizable reporting.
How a Smart Shopify Merchant Actually Uses These Reports
Let’s connect the dots with a real workflow:
- Check Inventory Sold Daily → Identify fast-moving products
- Check Days of Inventory Remaining → Spot stockout risks
- Check Sell-through Rate → Validate product performance
- Create Purchase Orders for high-performing SKUs
- Discount or bundle low-performing products
This entire process can take under 30 minutes weekly but has a massive impact on revenue and cash flow.
That’s the difference between reactive inventory management and data-driven operations.
Types of Inventory Reports in Shopify
Shopify offers a range of inventory reports to help you track stock levels, spot trends, and make smarter restocking decisions.
Here’s a rundown of the most useful inventory reports you’ll find:
Products by Sell-Through Rate
This report shows the percentage of available inventory that was sold over a specific time period. It helps you evaluate how efficiently products are moving off the shelves.
Formula:
Sell-Through Rate = (Units Sold ÷ Units Available at Start) × 100
Why it matters:
- Identifies fast-moving products that deserve priority for restocking.
- Flags underperforming SKUs that may be tying up cash or storage.
- Supports smarter replenishment and markdown strategies.
Use case:
You stocked 200 units of a seasonal candle and sold 160 in a month, your sell-through rate is 80%, indicating strong demand. Meanwhile, another variant has a sell-through of 12%, a candidate for a discount or clearance bundle.
Example decision:
Reorder the 80% performer, and reduce future orders for the slow mover.
ABC Product Analysis
This report ranks your products based on their revenue contribution, dividing them into three categories:
- A Products: Top sellers, usually 10–20% of SKUs generating 70–80% of revenue.
- B Products: Mid-range performers with moderate contribution.
- C Products: Low-volume or infrequently sold items.
Why it matters:
- Focuses your attention on the products that matter most to your bottom line.
- Helps prioritize inventory investment, marketing, and warehouse space.
- Enables tiered inventory control strategies (e.g., frequent checks for A items, occasional reviews for C).
Use case:
After running ABC analysis, you find your top 10 SKUs (out of 200) bring in 75% of your total revenue. You assign these products tighter stock thresholds, higher reorder frequency, and feature them more in your marketing.
Example decision:
Apply just-in-time restocking to “A” items, reduce ordering frequency for “C” items.
Inventory Sold Daily by Product
This report shows the average number of units sold per day for each product over a selected period. It's also known as sales velocity.
Why it matters:
- Crucial for reorder planning, you need to know how fast stock is moving.
- Supports stock cover planning (how many days you have left).
- Helps manage inventory for time-sensitive or perishable goods.
Use case:
You notice your top-selling skincare item is moving at 15 units per day. With 90 units in stock, you’ll run out in just 6 days. If your supplier takes 7–10 days to deliver, you're already late to reorder.
Example decision:
Set a reorder point based on average daily sales × lead time, plus safety stock.
Month-End Inventory Snapshot
A point-in-time report showing the stock level for each product as of the last day of the month. It includes product name, SKU, and quantity available.
Why it matters:
- Used for financial closing, inventory valuation, and tax filings.
- Helps track historical inventory trends month-over-month.
- Often required by accountants for calculating ending inventory in COGS.
Use case:
To close your March books, your accountant needs to know how many units you had in stock on March 31. This snapshot gives a clear, standardized view.
Example decision:
Use the data for monthly inventory reconciliation or compare with sales data to detect inventory mismatches.
Month-End Inventory Value
It displays the total value of your on-hand inventory at month's end. It multiplies the stock quantity of each item by its cost price (purchase or landed cost).
Why it matters:
- Supports balance sheet reporting and end-of-year tax documentation.
- Helps you understand how much capital is tied up in unsold inventory.
- Informs inventory turnover and performance ratios.
Use case:
Your month-end report shows $20,000 in inventory value, but your sales for the month were only $15,000. That suggests excess stock or slow movement, prompting a review of your purchasing strategy.
Example decision:
Reduce order volumes next month or run promotions to move high-value inventory.
Products by Days of Inventory Remaining
What it is:
This report estimates the number of days each product will last based on current stock levels and recent daily sales trends.
Formula:
Days Remaining = Inventory on Hand ÷ Average Units Sold Per Day
Why it matters:
- Prevents stockouts of fast sellers.
- Helps prioritize purchase orders based on urgency.
- Useful for lean inventory strategies (especially in DTC brands).
Use case:
Your hero product has 30 units left and sells 5 units/day → you’ve got 6 days of stock remaining. Since your supplier takes 7 days to deliver, this triggers an urgent PO.
Example decision:
Set automatic reorder points based on projected days of cover, with alerts when thresholds are hit.
Products by Percentage Sold
Tracks the percentage of total stocked inventory sold over a time period. It accounts for restocks and adjustments, making it more dynamic than the basic sell-through rate.
Why it matters:
- Helps identify slow movers that aren’t converting into sales.
- Useful for longer-term trend tracking and clearance decision-making.
- Complements margin analysis, knowing which products contribute vs. which sit idle.
Use case:
A product has 1,000 units stocked and has sold only 120 in 3 months, just 12% sold. That’s a red flag for storage costs and poor ROI.
Example decision:
Mark down or bundle the slow seller to improve sell-through and free up capital.
Best Practices for Inventory Reporting and Analysis
Inventory reporting isn’t just about pulling numbers from your dashboard, it’s about turning data into decisions.
Whether you’re running a small Shopify store or scaling a multi-channel operation, how you analyze and act on your inventory data can make or break your profitability.
Here are some tried-and-tested best practices to help you get the most out of your inventory reports:
1. Review Key Reports Weekly, Not Just Monthly
It’s tempting to only check reports at month-end, but by then, you’re reacting to what’s already happened. The best operators review inventory metrics at least weekly, especially for fast-moving or seasonal SKUs.
What to check weekly:
- Low stock alerts
- Sell-through rates
- Daily units sold
- Days of inventory remaining
Why it matters:
You can spot issues early before a stockout or overstock becomes a problem.
2. Set Reorder Points Based on Data, Not Gut Feel
Too often, merchants reorder stock just because "it looks low." That’s risky and imprecise.
Instead, base reorder points on:
- Average daily sales
- Lead time from suppliers
- Safety stock buffer
Formula to use:
Reorder Point = (Daily Sales × Lead Time in Days) + Safety Stock
Why it matters:
This approach reduces emergency orders and stockouts, especially when supply chains get unpredictable.
3. Segment Your Inventory for Better Control
Not all products need the same level of attention. Use techniques like ABC analysis to segment your inventory:
- A products: High-value, high-frequency sellers
- B products: Moderate movers
- C products: Low impact, often overstocked
Why it matters:
You don’t need to spend the same time managing every SKU. Focus your energy where it brings the most ROI.
4. Track Inventory Value Alongside Quantity
It’s not just about how many units you have, how much they cost you is equally important.
Best practice:
Pair your “quantity on hand” data with inventory value reports to:
- Understand how much cash is tied up
- Prioritize liquidating high-value slow movers
- Make smarter purchase decisions
Example:
You may have 200 units of two products, but one costs $3/unit and the other $60/unit. They shouldn’t be treated equally.
5. Analyze Trends, Not Just Snapshots
Snapshots (like month-end reports) are helpful but don’t tell the whole story. Tracking trends over time gives you better insight into:
- Seasonal shifts in demand
- Long-term stock efficiency
- Inventory turnover
Why it matters:
Trend analysis helps you anticipate rather than react.
6. Combine Inventory Data with Sales and Marketing
Inventory reporting shouldn’t live in a silo. Cross-reference it with your:
- Sales reports (e.g., bestsellers by revenue vs. units)
- Marketing calendar (e.g., planned promos, influencer drops)
- Customer returns data (e.g., if a high-return item is inflating sales)
Why it matters:
It gives you the whole picture, not just of what’s in your warehouse but also of why it’s there or moving slowly.
7. Use Automation and Alerts to Stay Proactive
Instead of manually checking reports every day, set up rules and alerts that work in the background.
Examples:
- Get notified when stock drops below 20 units
- Auto-tag low-sell-through SKUs for review
- Auto-generate purchase orders when thresholds are met
Why it matters:
It saves time and reduces the chances of human error, especially during busy periods.
Conclusion
Inventory reports aren’t just about knowing what’s in stock they’re about understanding how your products perform, where your money is tied up, and how to stay ahead of stockouts or overstocking.
When used consistently and correctly, they become a key part of running a more agile, profitable business.
Of course, reports are just one piece of the puzzle.
Small process improvements, like updating inventory in bulk or tracking bundles, can also make a big difference in keeping things smooth behind the scenes.
If you’re working with a large product catalog, you’ll appreciate having the right systems in place to act on what your reports are telling you.
Because in the end, it’s not just about having data. It’s about being able to use it easily, consistently, and confidently.
Try Sumtracker to turn your inventory data into clear, actionable decisions.
FAQS
1. Can I customize Shopify’s inventory reports?
Shopify’s built-in reports have some filtering options but are not fully customizable. If you need more advanced reporting like filtering by product tags, or combining sales and inventory data, you’ll need a tool like Sumtracker from the Shopify App Store.
2. How often should I check inventory reports?
Ideally, you should review key inventory metrics (like low stock items, sales velocity, and inventory value) at least once a week. A daily review of low stock alerts and bestsellers is recommended for high-volume or fast-moving stores.
3. What’s the best way to use these reports for reordering stock?
Use a combination of Inventory Sold Daily by Product, Days of Inventory Remaining, and your supplier’s lead times to calculate accurate reorder points. This ensures you’re not ordering too late or too much.
4. What if my inventory reports don’t match what I see in my store?
This could be due to syncing delays, manual inventory adjustments, or app conflicts. Always double-check recent stock movements, sales orders, and third-party integrations that may update inventory in the background.
Conclusion
Related Articles
Tool and strategies modern teams need to help their companies grow.
.avif)
.avif)

Ready to Simplify Your Inventory Management?
Join hundreds of e-commerce merchants who rely on Sumtracker to save time, eliminate errors, and grow their business.
