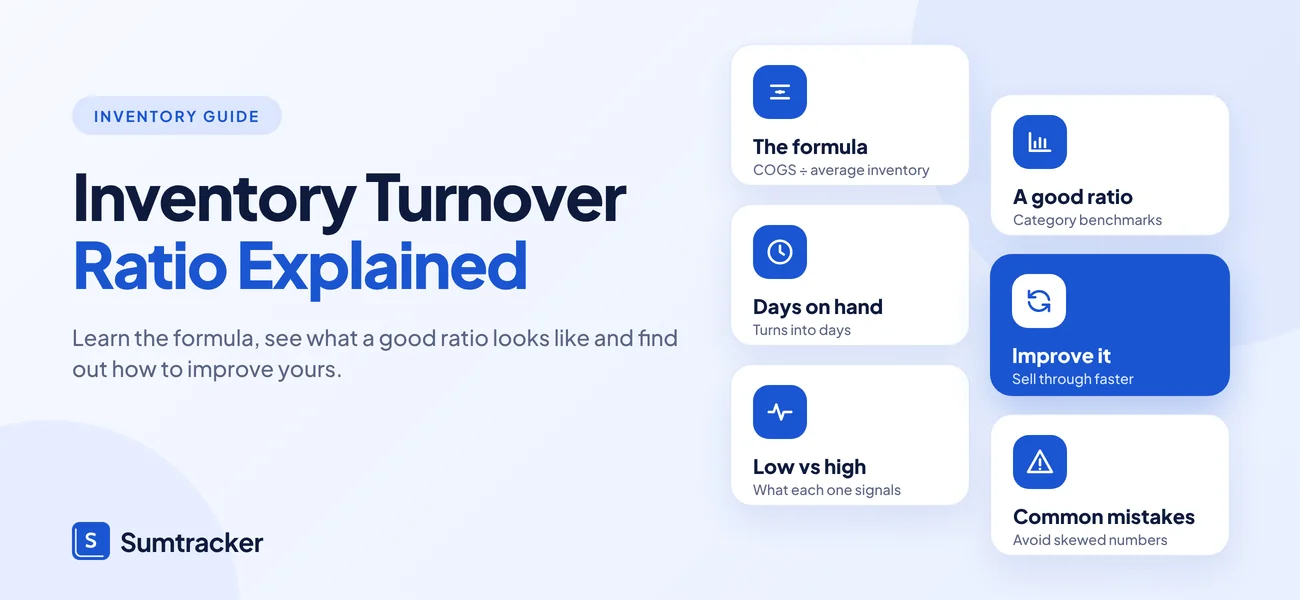
Inventory Turnover Ratio Explained: What It Is & Why It Matters


Inventory turnover ratio shows how many times you sell and replace your stock in a period. Divide cost of goods sold by average inventory, then divide 365 by the result to get days inventory outstanding.
- Example: $200,000 COGS ÷ $50,000 average inventory = 4 turns, or about 91 days on the shelf.
- Public apparel companies turn about 5.2 times a year, consumer electronics 7.3 and household products 8.7 (Damodaran, January 2026). These are sales-based, so your COGS-based ratio will usually come out lower.
- Use inventory at cost, track your own trend by category, and treat low turns as an overstock warning and very high turns as a stockout risk.
How many times did you sell through your entire inventory last year?
If you don’t know the answer, you might be missing a key insight into how your business is performing.
The Inventory turnover ratio gives you a clear view into how fast your products are moving and whether your cash is tied up in slow-moving stock or being reinvested in growth.
In this blog, we’ll break down the formula, explain the numbers, and help you improve your inventory strategy without overcomplicating it.
What Is Inventory Turnover Ratio?
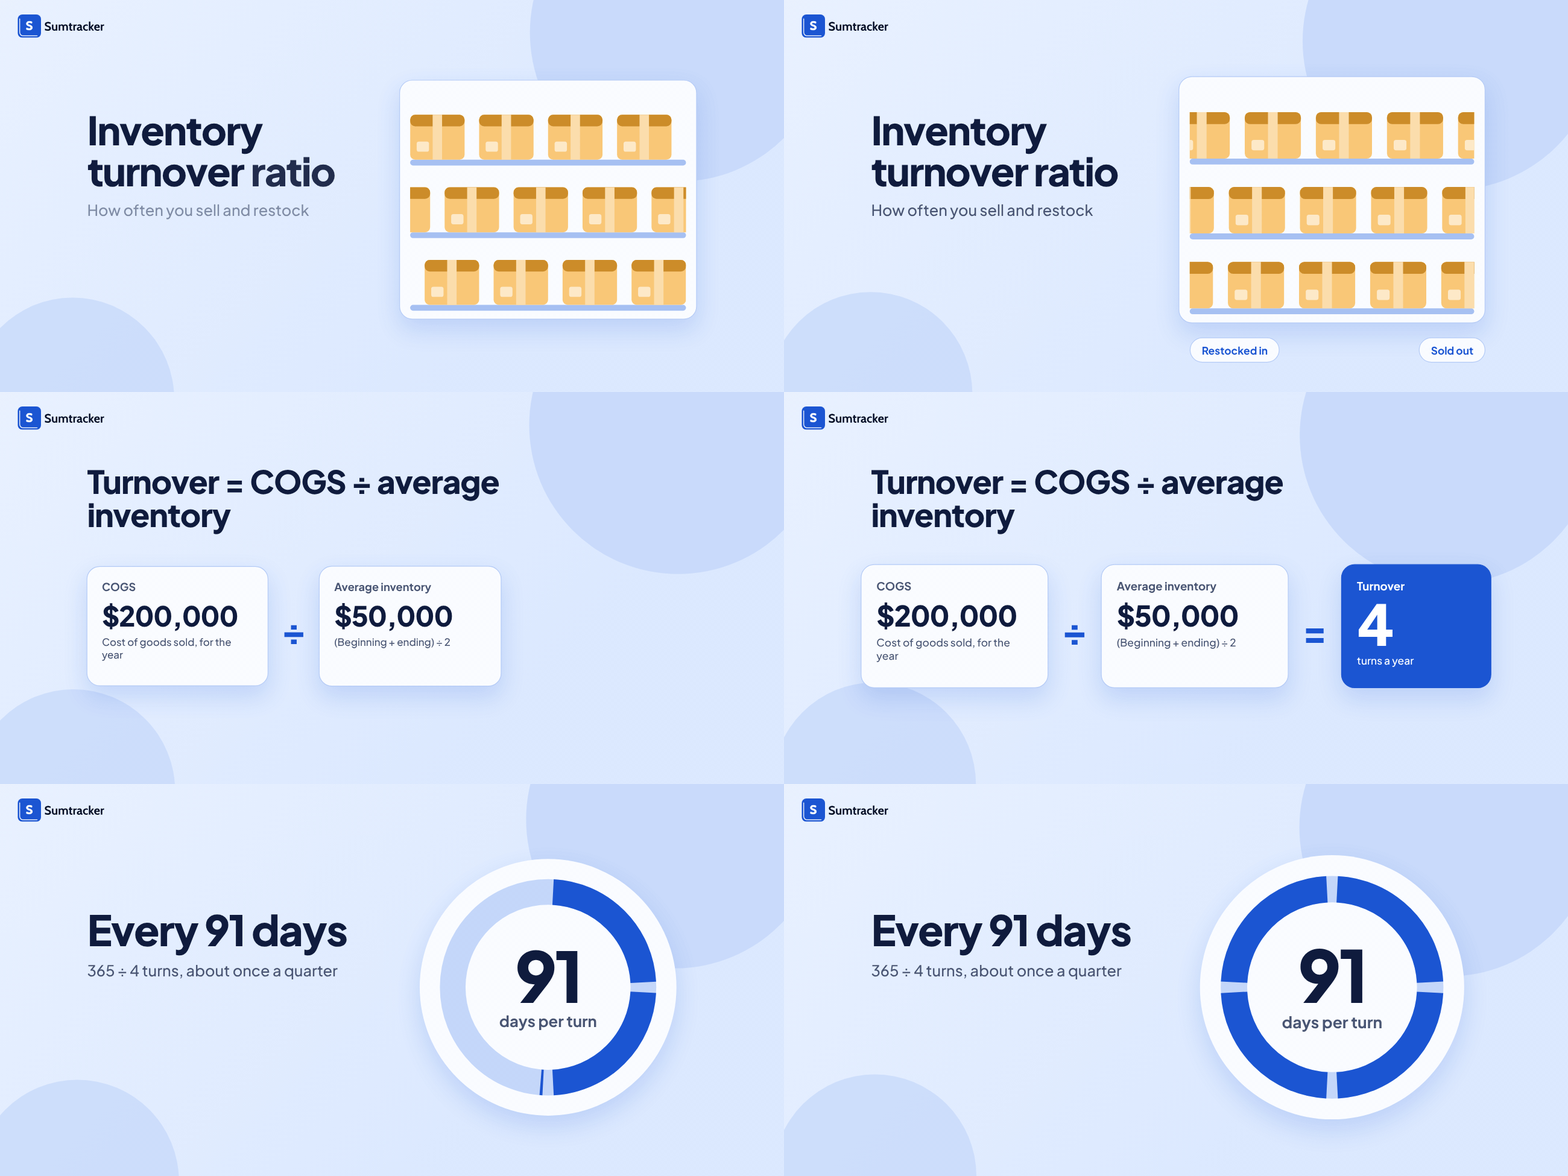
Inventory Turnover Ratio tells you how many times you’ve sold and replaced your inventory over a specific period, usually a year. It gives you a clear picture of whether your products are flying off the shelves or just collecting dust.
In simple terms:
It measures how efficiently you’re managing and selling your inventory.
High turnover usually means strong sales or great stock control.
Low turnover?
That might point to overstocking, poor demand forecasting, or dead stock issues.
Why Inventory Turnover Matters
Inventory is cash in a box. Until it sells, you can’t spend it.
Turnover tells you how fast that cash comes back. When it’s healthy, you can:
- Reinvest faster in products that sell
- Pay less for storage and handling
- Avoid markdowns on stock that ages out
- Spot demand shifts before they hurt margins
When turnover drops, cash gets stuck, storage bills grow, and old stock loses value.
Even the biggest brands feel it. In the quarter ended November 30, 2022, Nike’s inventory jumped 43% to $9.3 billion. Its cost of sales grew only 24%. Inventory grew almost twice as fast as the cost of selling it, which means a slower turn. Nike’s gross margin also fell 3 points to 42.9%. The company said the rise came from more units after the prior year’s supply chain disruption, plus higher input costs.
It adds up across the whole industry. IHL Group estimated that inventory distortion, the combined cost of overstocks and out-of-stocks, would cost retailers worldwide $1.77 trillion in 2023.
Want to hear how this plays out for ecommerce brands?
On the Ecomm Breakthrough podcast, host Josh Hadley talks with supply chain consultant Art Koch about why inventory behaves like a depreciating asset, why a small share of sales drives most of the complexity, and why accurate inventory data matters.
How to Calculate Inventory Turnover Ratio
The formula is simple:
Inventory Turnover Ratio = Cost of Goods Sold (COGS) ÷ Average Inventory
Here’s how to work it out:
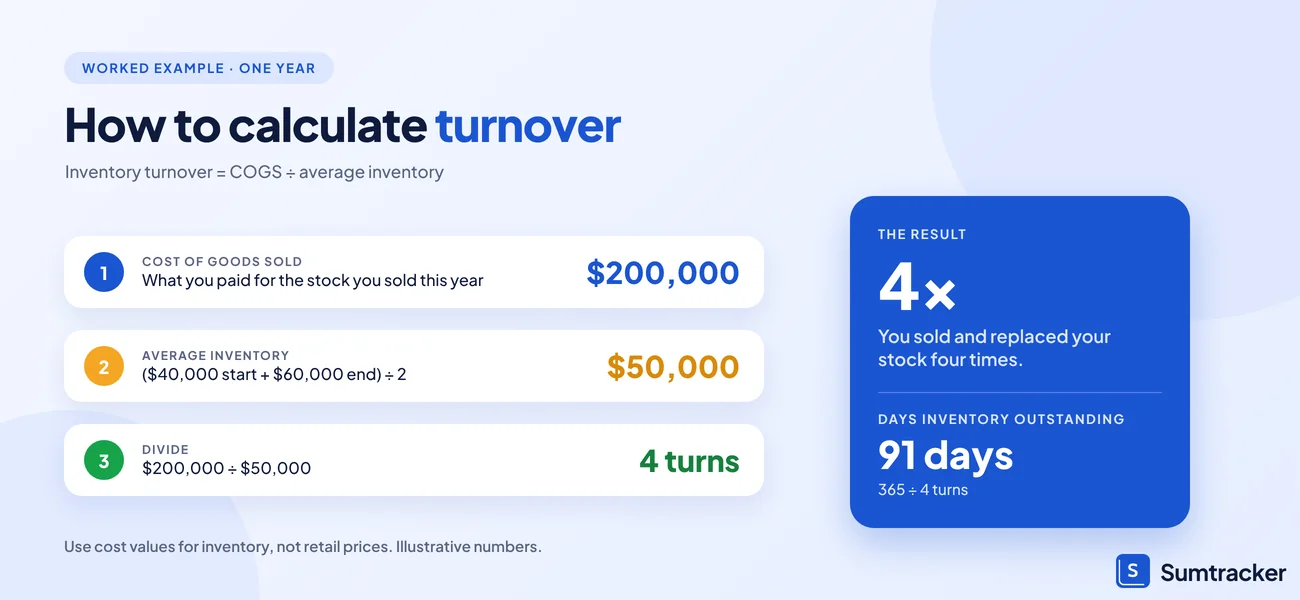
- Find your COGS for the period (usually a year).
- Find your average inventory. Add beginning inventory and ending inventory, then divide by 2. Average Inventory = (Beginning Inventory + Ending Inventory) ÷ 2
- Divide COGS by average inventory.
Example:
Say your COGS is $200,000 and your average inventory is $50,000.
Inventory Turnover Ratio = $200,000 ÷ $50,000 = 4
You turned over your inventory four times that year. That’s one full cycle about every 91 days (365 ÷ 4).
Don’t want to do the math by hand? Use the free calculator below. Enter your COGS and beginning and ending inventory, and get your ratio and days inventory outstanding in seconds.
Inventory turnover ratio calculator
Your numbers
Your result
Enter your COGS and both inventory values to see your result.
Use inventory at cost, not retail price. Average inventory = (beginning + ending) ÷ 2.
A calculator gives you one number for one period. The ratio only becomes useful when you watch how it moves month to month, and the template below does that for you.
FREE TEMPLATE
Inventory Turnover Tracker
Log your COGS and month-end inventory once a month. The formulas are built in, so it works out:
- Rolling 12-month average inventory for the whole business.
- Turnover and days inventory outstanding for each category.
- A flag on any category that slips below its own trend.
Inventory Turnover Ratio vs Days Inventory Outstanding
Turnover tells you how many times you sell your stock. Days inventory outstanding (DIO) tells you how long it sits.
DIO = 365 ÷ Inventory Turnover Ratio
You may also see it called days sales of inventory (DSI) or days on hand. It’s the same idea.
Days are easier to plan around. Your supplier lead times are in days. So are your storage terms.
| Turnover ratio | Days inventory sits |
|---|---|
| 4 | 91 days |
| 6 | 61 days |
| 8 | 46 days |
| 12 | 30 days |
Compare your number with your supplier lead time. You’ll see how much cushion you have before stock runs out.

What’s a Good Inventory Turnover Ratio?
There’s no single “good” number. It depends on what you sell, your lead times, and how often customers buy.
Here’s how some common consumer categories compare:
| Category | Turnover (times per year) | Days inventory sits |
|---|---|---|
| Apparel | 5.2 | 70 |
| Furniture and home | 5.5 | 66 |
| Consumer electronics | 7.3 | 50 |
| Household products | 8.7 | 42 |
Source: Damodaran Online, NYU Stern, January 2026. Figures reflect public companies in each category. They use sales, not COGS, so your own ratio will usually come out lower. Days = 365 ÷ the turnover shown.
These categories sit between about 5 and 9 turns a year. For a wider view, US retailers held about 1.36 months of sales in inventory in August 2026, according to Census Bureau data.
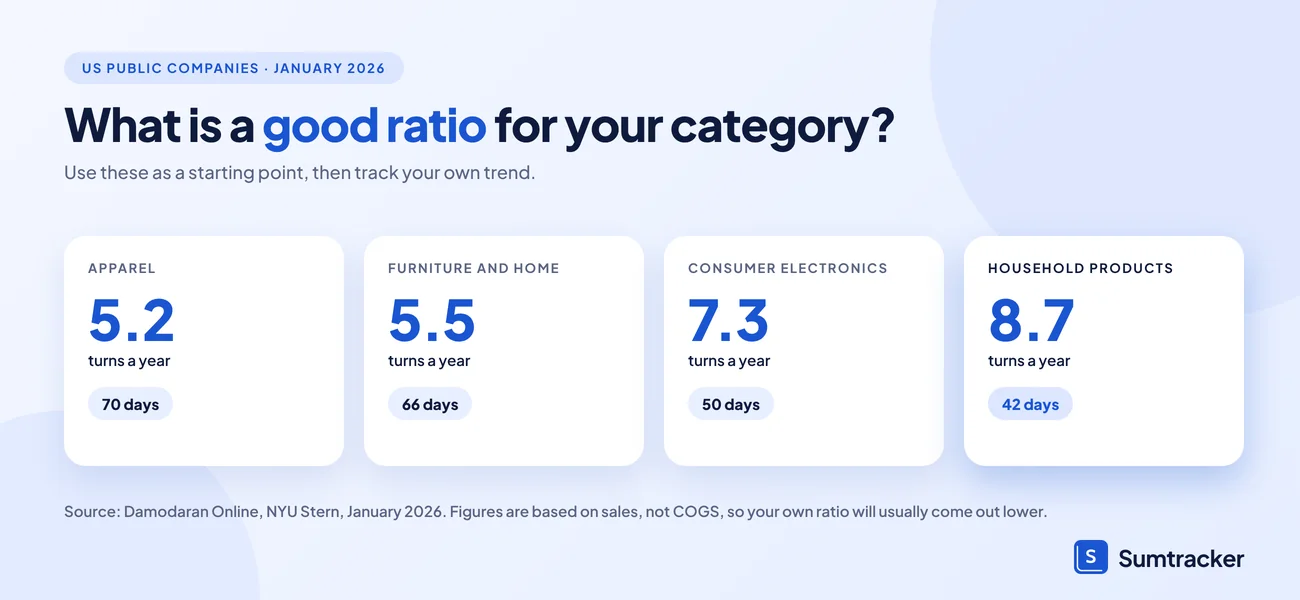
Use these as a starting point, not a target. Compare yourself with sellers of similar products. Then track your own trend. A ratio that improves over time matters more than a perfect number.
- Too low? You may be overstocked or selling slowly.
- Too high? You may be running lean and risking stockouts.
The key is to align turnover with your product lifecycle, lead times, and customer demand.
Want these numbers handy? Download our free one-page inventory turnover cheat sheet with the formula, the turns-to-days table, and the category benchmarks.
Low vs High Inventory Turnover: What Do They Mean?
Your inventory turnover ratio isn’t just a number, it tells a story about how your business runs day to day.
Low Inventory Turnover
A low ratio means your products aren’t selling quickly. That could point to:
- Overstocking or poor demand planning
- Products that are outdated or not in demand
- Pricing that’s too high compared to competitors
What it leads to:
Cash tied up in unsold stock, higher storage costs, and increased risk of inventory becoming obsolete.
Margins take the hit too. In the first quarter of 2022, US retailer Target’s gross margin rate fell to 25.7% from 30.0% a year earlier. The company pointed to gross margin pressure reflecting actions to reduce excess inventory.
High Inventory Turnover
A high ratio means you’re selling quickly and restocking often. That sounds great, but it comes with its own risks:
- Frequent stockouts if you’re not replenishing in time
- Pressure on operations and suppliers
- Potential missed sales if demand spikes unexpectedly
How to Improve Your Inventory Turnover Ratio
Improving your inventory turnover ratio means selling through your stock faster, without risking frequent stockouts. It’s about smarter planning, not just faster selling.
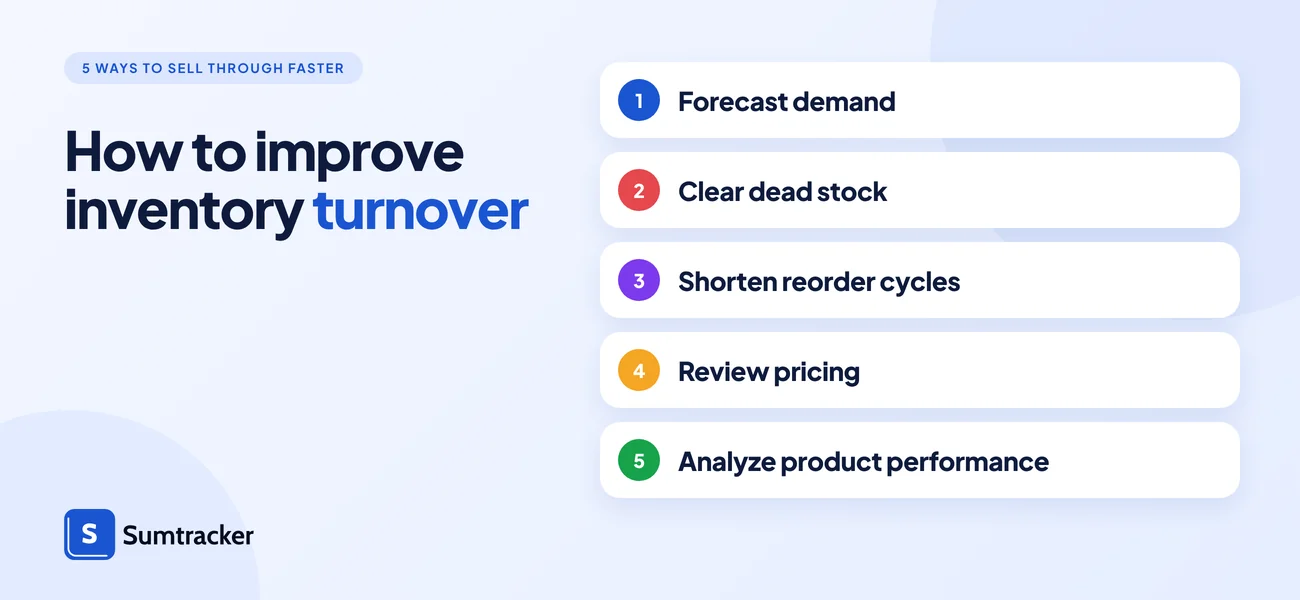
Here are effective ways to improve it:
- Forecast Demand Accurately: Use past sales data, seasonality trends, and market insights to predict what will sell. Better forecasting helps you stock only what’s needed and avoid overordering.
- Clear Out Slow-Moving Stock: Run targeted discounts, bundle offers, or limited-time deals to move older inventory. This frees up space and cash for high-demand products.
- Shorten Reorder Cycles: Instead of placing large, infrequent orders, consider smaller, more frequent reorders. This keeps inventory fresher and reduces holding costs.
- Review Pricing Strategy: If items aren’t selling, pricing might be the issue. Small adjustments can increase sell-through while protecting your margins.
- Analyze Product Performance Regularly: Track inventory turnover by product or category. Drop or adjust SKUs that consistently underperform and double down on bestsellers.
Case study: ASOS. UK online fashion retailer ASOS shows what a turnaround in stock looks like at scale. Its stock levels had doubled to £1.1 billion by the end of its 2022 financial year. By the end of its 2025 financial year, the company had cut stock to about £400 million, down roughly 60%, and had reduced its stock cover by about 25% over the last two years through a more disciplined inventory process.
The payoff showed up in margin as well as cash. ASOS reported an adjusted gross margin of 47.1%, up 370 basis points, helped by selling more at full price and marking down less. You don’t need ASOS’s scale to use the same idea: buy less of what sells slowly, and watch how many days of stock you hold.
Common Mistakes in Measuring Inventory Turnover
Many businesses miscalculate the inventory turnover ratio without realizing it, resulting in misleading insights and poor inventory decisions. To make the ratio work for you, it’s important to avoid these common mistakes:
- Using Sales Revenue Instead of COGS: The turnover formula requires Cost of Goods Sold (COGS). Using sales revenue instead inflates the ratio and distorts performance.
- Not Updating Inventory Values Regularly: Using outdated or inaccurate beginning and ending inventory values skews the average and leads to unreliable results.
- Ignoring Category-Level Tracking: Measuring turnover for your entire inventory can hide underperforming products. Tracking by category or SKU gives clearer insights.
- Overlooking Seasonality: Comparing seasonal product turnover across non-peak months can be misleading. Always consider the time period and sales cycle.
- Using Retail Value Instead of Cost: Inventory should be measured at cost, not retail price. Using retail value overstates inventory and throws off the calculation.
The tracker template above avoids most of these mistakes. It uses COGS and inventory at cost, works from month-end values, and tracks each category separately.
Conclusion
Inventory turnover ratio is a window into the health of your business. It demonstrates how effectively you’re managing cash flow, inventory decisions, and customer demand.
Whether your turnover is too low (and costing you in holding fees) or too high (and risking stockouts), the goal is balance.
Improving turnover begins with enhanced visibility, accurate data, and expedited decision-making.
Sumtracker keeps inventory from all your channels in one dashboard. It shows what needs restocking and what’s overstocked, and you can create purchase orders straight from reports. You also get low stock alerts for each SKU. So instead of guessing, you act on the right numbers.
Master your turnover ratio, and you’ll not only move inventory, you’ll move your business forward.
FAQs
What is the inventory turnover ratio?
It’s a metric that shows how many times your inventory is sold and replaced over a period. It helps measure how efficiently you manage and sell your stock.
How often should I calculate the inventory turnover ratio?
It’s best to calculate it monthly or quarterly to catch trends early, especially if your sales are seasonal. Annual calculations provide a big-picture view, but frequent checks facilitate faster decision-making.
What does a low inventory turnover ratio indicate?
A low ratio typically means products are selling slowly. This could be due to overstocking, poor demand forecasting, or low demand for the product. It often leads to higher holding costs and cash flow issues.
Can a high inventory turnover ratio be a bad thing?
Yes. While it often indicates strong sales, a very high turnover ratio could mean you’re understocked and frequently running out of inventory, leading to missed sales and customer dissatisfaction.
Should I calculate inventory turnover using retail value or cost?
Always use the cost of goods sold (COGS) and inventory at cost, not retail value. This gives you an accurate view of how efficiently you're managing stock from a financial perspective.
What is days inventory outstanding (DIO)?
DIO shows how many days it takes to sell your inventory on average. Divide 365 by your inventory turnover ratio. A ratio of 4 means your stock sells in about 91 days.
What is a good inventory turnover ratio for my industry?
It depends on what you sell. Public apparel companies turn inventory about 5.2 times a year, consumer electronics about 7.3, and household products about 8.7. These figures are sales-based (Damodaran, January 2026). Compare yourself with similar products, then track your own trend.
Conclusion
Inventory turnover ratio is a window into the health of your business. It demonstrates how effectively you’re managing cash flow, inventory decisions, and customer demand.
Whether your turnover is too low (and costing you in holding fees) or too high (and risking stockouts), the goal is balance.
Improving turnover begins with enhanced visibility, accurate data, and expedited decision-making.
Sumtracker keeps inventory from all your channels in one dashboard. It shows what needs restocking and what’s overstocked, and you can create purchase orders straight from reports. You also get low stock alerts for each SKU. So instead of guessing, you act on the right numbers.
Master your turnover ratio, and you’ll not only move inventory, you’ll move your business forward.

Bhoomi writes about inventory management and multichannel selling at Sumtracker. Her focus is on solving real operational problems for Shopify, Amazon, and marketplace sellers through well-researched content. She covers everything from multi-location inventory syncing and stock error troubleshooting to replenishment planning and platform comparisons, turning complex eCommerce operations into clear, actionable guidance.
LinkedInRelated Articles
Tool and strategies modern teams need to help their companies grow.

Ready to Simplify Your Inventory Management?
Join hundreds of e-commerce merchants who rely on Sumtracker to save time, eliminate errors, and grow their business.